
Interactive Drawing Interface for Editing Scene Graph
Published in The 21st International Conference on Cyberworlds (CW2022), Kanazawa, Japan, 2022
Abstract:
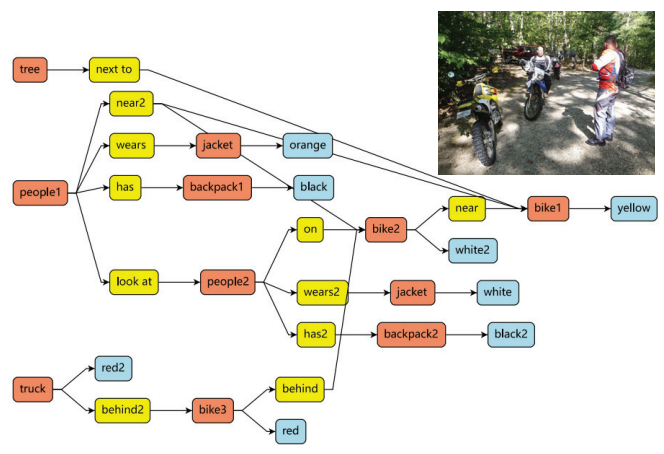
Scene graphs have been widely used in various visual applications, such as image retrieval and generation. However, it is time consuming and challenging to draw scene graphs, especially for images with complex scenes. To resolve this issue, we propose an interactive editing interface for scene graph representation in which users can draw scene graphs simply and conveniently. We provide alternatives for frequently used objects, attributes, and relationships in graph drawing. The proposed function design can greatly reduce the drawing time cost and improve drawing quality. We conducted a user study and confirmed that the proposed interface can help users draw the desired scene graph, as well as providing a good user experience.
Framework:
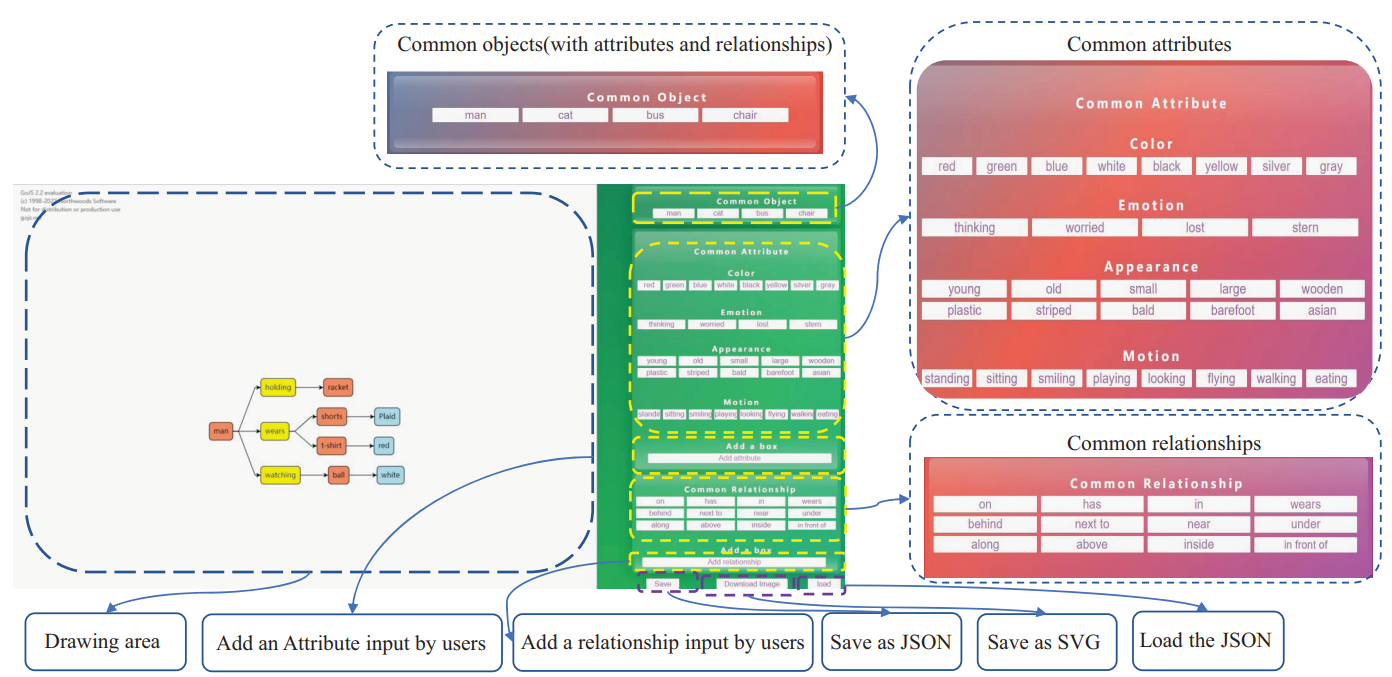
Fig. 2 shows our web-based editing interface. The left side of the editing interface is the drawing canvas, and the right side is a tool box of button functions. The operations are designed so as to be consistent with users’ daily habits in terms of document editing, such as undo, adding, connecting, removing, cloning, saving, and loading.The removing and linking functions help users change the graph structure during the drawing process. After completing the editing process, the scene graph can be stored as JSON or SVG files. After that, users can select the stored scene graphs and use the load function to load the graph structure.
Recommended citation: Tianyu Zhang, **Xusheng Du**, Chia-Ming Chang, Xi Yang, Haoran Xie.